
Using Business Tax Rankings for Location Decisions
What do tax rankings actually tell us about the cost of doing business in a state? See what three common business tax assessments indicate about a business’s bottom line.
January 2024 — 11 minute read
By Jessica Jackson, Rachel Gretencord, Dustin Nord, and Ben Iannuzzi
Introduction
When making a location decision, company leadership will often ask how the tax structure in different jurisdictions will impact the company’s bottom line. To help with these comparisons, some businesses choose to utilize one or more of the multiple state business tax rankings published annually as a benchmark in the initial vetting process. However, with different studies on the same topic reaching dramatically different conclusions about states’ business tax environments, it is critical to understand the methodology and implications of a ranking before using it as the basis for decision making.
Some of the most widely used approaches to assessing corporate tax burdens include evaluating state and local statutory corporate tax rates; the Tax Foundation’s annual State Business Tax Climate Index; and Ernst and Young’s Total State and Local Business Taxes annual report. Some of these sources take a quantitative approach, while others include an assessment of the structural aspects of business tax systems as well. This paper serves as a guide to understanding what each methodology is measuring so business leaders who choose to rely on these measures can decide which ranking provides the most appropriate information to inform their business location decision.
Statutory Corporate Income Tax Rates
As a first step, many businesses look at state and local statutory corporate tax rates. While this method is straightforward in its approach, there are also significant limitations. For example, statutory rates alone do not account for each state’s definition of taxable corporate income, and many states offer significant deductions that can materially impact the amount of taxes due. In addition, statutory rates do not account for many non-income taxes and fees paid by businesses, such as payroll taxes and property taxes1. The statutory rate also does not account for generous credits offered by many states, such as job creation or research and development tax credits, that reduce the tax liability of a company that participates in qualifying activities. Furthermore, some states use alternative taxes such as a gross receipts tax, so their rates are not directly comparable.
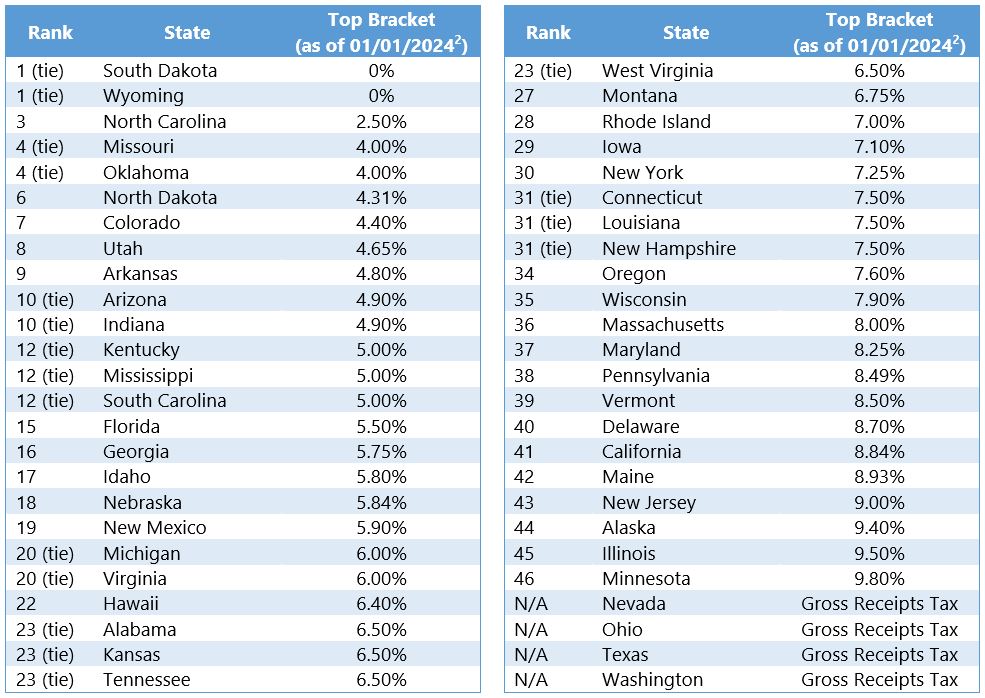
When examining statutory corporate income tax rates, it also becomes clear that this metric alone is insufficient to draw many conclusions about the differences among states. (See Table 1.) Though outliers certainly exist, when ranking states from lowest to highest corporate tax rate, there are many states with the same statutory rate (noted as “ties” in Table 1). Many more states have corporate tax rates within a few basis points of one another. Given the limitations of the statutory rates listed above, it would be possible for a state with a higher top corporate tax bracket but with more generous deductions and credits to have a lower tax burden than a state with a lower statutory rate. Accordingly, statutory rates alone do not provide a sufficient basis to determine where a company’s taxes may be lowest.
Table 1: Statutory Corporate Income Tax Rates
Tax Foundation State Business Tax Climate Index3
A second metric, heavily reported in business media and referenced by many corporate decisionmakers, is the Tax Foundation’s State Business Tax Climate Index. Published annually, the State Business Tax Climate Index provides a ranking based on the structure of each state’s tax system. States that rank well in this analysis tend to have one or more of the following characteristics: 1) absence of a major tax category, such as corporate income tax, sales tax, or personal income tax; 2) low tax rates and a broad base; and/or 3) neutral and not overly complex structure4. The State Business Tax Climate Index methodology elevates states with tax systems that they have determined “minimize tax-induced economic distortions.”5
Although the Tax Foundation is clear about their methodology and intent, many readers mistakenly interpret the State Business Tax Climate Index as a measure of business tax burden. While some of the measures in the Index reward states with lower tax rates, other criteria penalize states for policies that reduce taxes for certain groups. For example, in states with graduated tax structures, states where the top individual income tax rate kicks in at a lower income level score better, even though the result may be that more individuals are subjected to the top tax rate. The State Business Tax Climate Index also faults states for offering tax breaks and credits. Again, this is because the scoring rubric is meant to demerit states who complicate the tax system and distort the market, even if the result of the credit is a lower tax bill. The Tax Foundation has observed—as this paper also noted above—that there is little difference between many states’ statutory rates:
“Many states’ tax rates are so close to each other that an absolute index would not provide enough information about the differences among the states’ tax systems, especially for pragmatic business owners who want to know which states have the best tax system in each region.”6
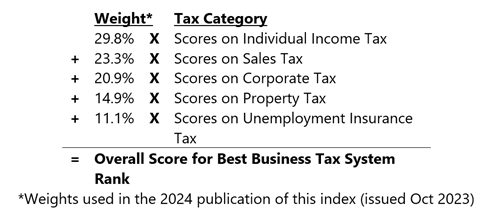
The Tax Foundation State Business Climate Index measures 125 variables across five categories and is weighted by variability in a given analysis year. This methodology works to highlight categories where there are differences between states, identifying genuine variances. But this also means the categories are not weighted by relevance to a business’s bottom line. One additional feature of this methodology is that—because it weights more heavily the categories with more variability—it creates a ranking with few to no “ties,” even when the quantifiable differences in business taxes across states are negligible. The State Business Tax Climate Index methodology for 2024 is illustrated in Figure 1.
Figure 1: Tax Foundation State Business Tax Climate Index Methodology, 2024
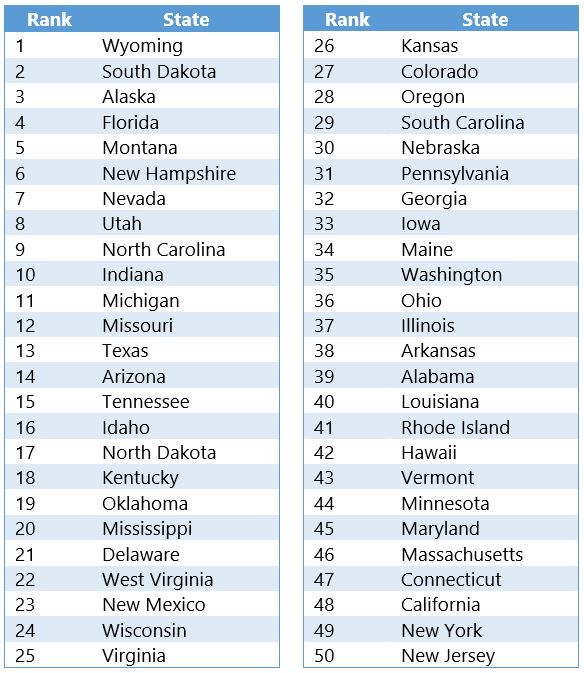
The 2024 State Business Tax Climate Index yielded the results shown in Table 27.
Table 2: 2024 State Business Tax Climate Index Rankings
Ernst & Young (EY) Total Effective Business Tax Rate8
For companies looking for an analysis of what businesses pay in taxes by state, the Total Effective Business Tax Rate (TEBTR) in Ernst & Young’s annual “Total State and Local Business Taxes” report provides insights. This publication provides a straightforward, quantitative measure of effective business taxes by state using U.S. Census Bureau data. EY’s approach is to measure all of the taxes ultimately borne by businesses, divided by the total taxable business activity. This methodology is illustrated in Figure 2.
Figure 2: EY Total Effective Business Tax Rate Methodology
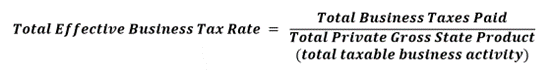
EY’s definition of business taxes includes property taxes paid by businesses; sales and excise taxes on intermediate inputs and capital expenditures purchased by businesses; business entity taxes, such as the corporate income tax, gross receipts tax, franchise tax and license taxes on businesses and corporations; the share of individual income taxes paid by owners of noncorporate businesses (pass-through entities); unemployment insurance taxes, and all other state and local taxes that are the statutory liability of business taxpayers. As such, it uses a very broad measure of taxes, rather than focusing only on one element, such as the statutory corporate tax rate.
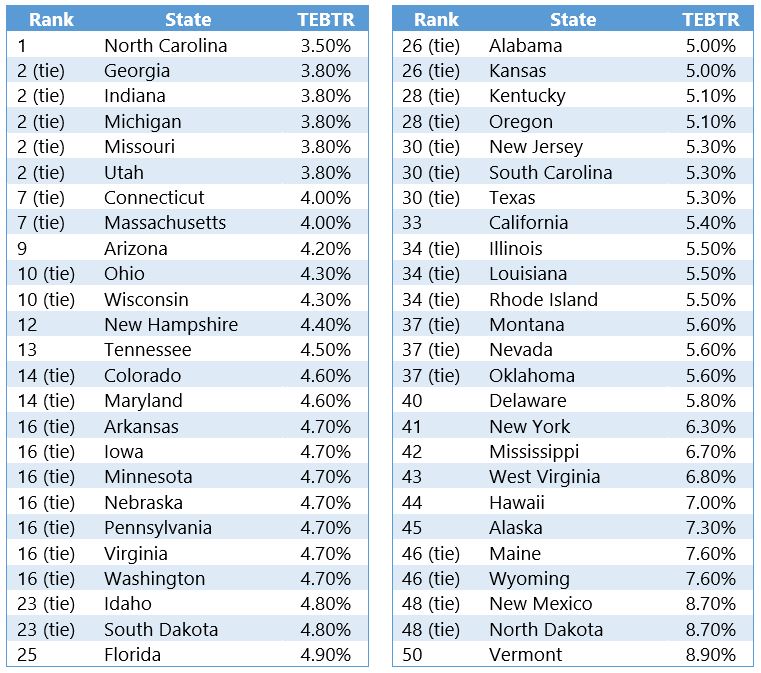
Due to the complexity of each state’s state and local tax burden, EY’s TEBTR does not capture economic incidence or administrative burden9. Furthermore, TEBTR is a measure of aggregate economic activity taxed by the state; it is not a measure of what any individual company might have paid. That said, it is one of the most comprehensive publications for measuring state and local business tax burden across all states. EY’s TEBTR yielded the results shown in Table 3 in the latest publication, analyzing FY 2022 tax data and published in December 2023. It should be noted, similar to the assessment of statutory rates and Tax Foundation observations, a large number of states are tied or within a few basis points of each other in the EY analysis.
Table 3: 2023 Ernst and Young Total Effective Business Tax Rate by State
Alternative Business Tax Burden Measurement
Beyond its discussion of the total effective business tax rate, Ernst and Young also posits that the amount of taxes paid by a business is an incomplete measure of business tax burden because it ignores the benefits that businesses receive from government spending. Two businesses facing identical tax liabilities do not face the same tax burden if one receives larger benefits from government spending than the other.
Using a methodology developed by the Federal Reserve Bank of Chicago, EY allocates all state and local government expenditures between businesses and households and estimates to what extent each group benefits from different types of expenditures10. For example, health and human services were allocated entirely to households, whereas highway infrastructure and public safety were allocated equally to households and businesses. The “business tax-to-benefit” ratio estimates are highly sensitive to how education spending is allocated because it is the largest state and local government spending category. There is also considerable uncertainty to the magnitude of benefit that businesses receive from education spending. For those reasons, EY provides a range of estimates for the share of educational expenditures that benefit businesses- 0%, 25%, and 50%. This metric is suggested by EY as a good alternative to measure the true burden of business taxation.
Comparing Business Tax Rankings
Figure 3 maps the results of the Tax Foundation and EY business tax reports published in 202311.
Figure 3: State Business Tax Climate Index and Total Effective Business Tax Rate
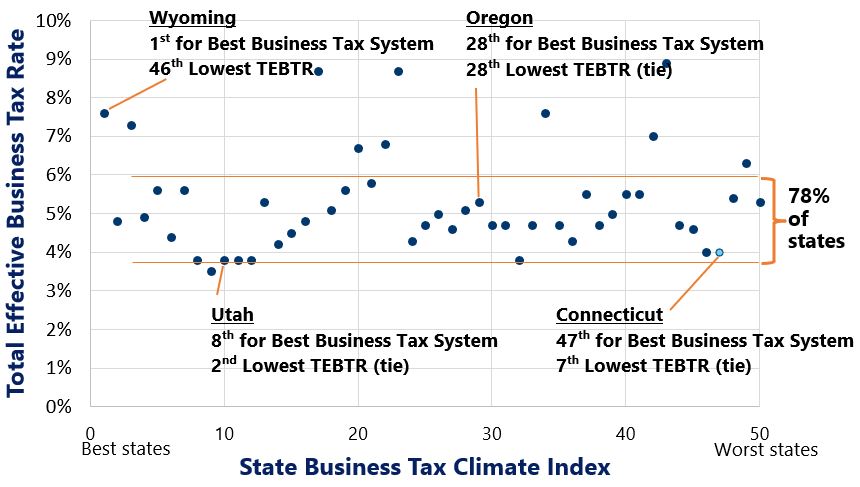
This illustrates there is no correlation between the results of these two methodologies12. While some states, such as Utah and Oregon, score similarly under both methodologies, there are significant departures as well. Businesses in the aggregate often pay more taxes in states that rank well with Tax Foundation’s State Business Tax Climate Index (e.g., Wyoming) and pay less in taxes in states that rank poorly under the Tax Foundation methodology (e.g., Massachusetts and Connecticut). Furthermore, most states have very similar effective business tax rates, with 78% of states within 2 percentage points of each other. This substantiates the Tax Foundation’s observation that there are not significant differences between state tax rates. In fact, rankings based on quantifiable measurements typically have many “ties” because of the minimal differences in business taxes across the states.
Conclusion
At the topline level, many states’ tax systems look similar. Certain rankings do a good job of indicating how taxes are structured or assessing the overall tax burden on businesses at the macro scale. However, these measures do not capture the nuance within each tax structure. Deductions and credits designed to incentivize certain business activities or particulars of a company’s operations can significantly impact how it is taxed. While these broad rankings may be valuable for policymakers to understand their state’s business tax structure and burden, companies looking for accurate information to factor into a location decisions should consult an accountant or tax professional to calculate the actual tax impact of different locations based upon the company’s operations and circumstances.
1Tannenwald, Robert. “State Business Tax Climate: How Should It Be Measured and How Important Is It?” Federal Reserve Bank of Boston, New England Economic Review, Jan/Feb 1996.
2Loughead, Katherine. “State Corporate Income Tax Rates and Brackets, 2024.” The Tax Foundation, January 2024, https://taxfoundation.org/data/all/state/state-corporate-income-tax-rates-brackets-2024/#:~:text=percent%20in%202027.-,New%20Jersey,to%209%20percent%20in%202024.
3Walczak, Jared, et al. “2024 State Business Tax Climate Index.” The Tax Foundation, October 2023, https://taxfoundation.org/wp-content/uploads/2023/10/2024-State-Business-Tax-Climate-Index-1.pdf.
4Walczak, Jared, et al. “2024 State Business Tax Climate Index.” The Tax Foundation, October 2023, https://taxfoundation.org/wp-content/uploads/2023/10/2024-State-Business-Tax-Climate-Index-1.pdf.
5Walczak, Jared, et al. “2024 State Business Tax Climate Index.” The Tax Foundation, October 2023, https://taxfoundation.org/wp-content/uploads/2023/10/2024-State-Business-Tax-Climate-Index-1.pdf.
6Walczak, Jared, et al. “2024 State Business Tax Climate Index.” The Tax Foundation, October 2023, https://taxfoundation.org/wp-content/uploads/2023/10/2024-State-Business-Tax-Climate-Index-1.pdf.
7Policies analyzed in 2023.
8Phillips, Andrew. “Total state and local business taxes: State-by-state estimates for FY22.” Ernst & Young, December 2023, https://www.cost.org/globalassets/cost/stri/studies-and-reports/fy-2022-ey-cost-50-state-bus-tax-study_optimized.pdf.
9Economic incidence is the final distribution of the economic burden from taxation. For example, in the case of corporate income tax, a certain amount of the tax will be shifted off of the company and onto the consumer in the form of higher prices. Tax burden can also be shifted to the company’s workers and/or shareholders. Administrative burden is referring to how complicated or simple it is to calculate and file your taxes.
10Phillips, Andrew. “Total state and local business taxes: State-by-state estimates for FY22.” Ernst & Young, December 2023, https://www.cost.org/globalassets/cost/stri/studies-and-reports/fy-2022-ey-cost-50-state-bus-tax-study_optimized.pdf.
11The Ernst and Young report is for fiscal year 2022; the Tax Foundation analysis evaluates tax systems in place as of July 1, 2023.
12The Pearson correlation coefficient between the Tax Foundation ranking and the EY TEBTR was 0.0382, which falls into the “negligible” correlation category. See Shober, Patrick MD, PhD, et al. “Correlation Coefficients: Appropriate Use and Interpretation.” Anesthesia & Analgesia, May 2018, https://journals.lww.com/anesthesia-analgesia/fulltext/2018/05000/correlation_coefficients__appropriate_use_and.50.aspx.

